How UFO Sightings Are Mapped Geographically
Techniques and Tools Used for Tracking

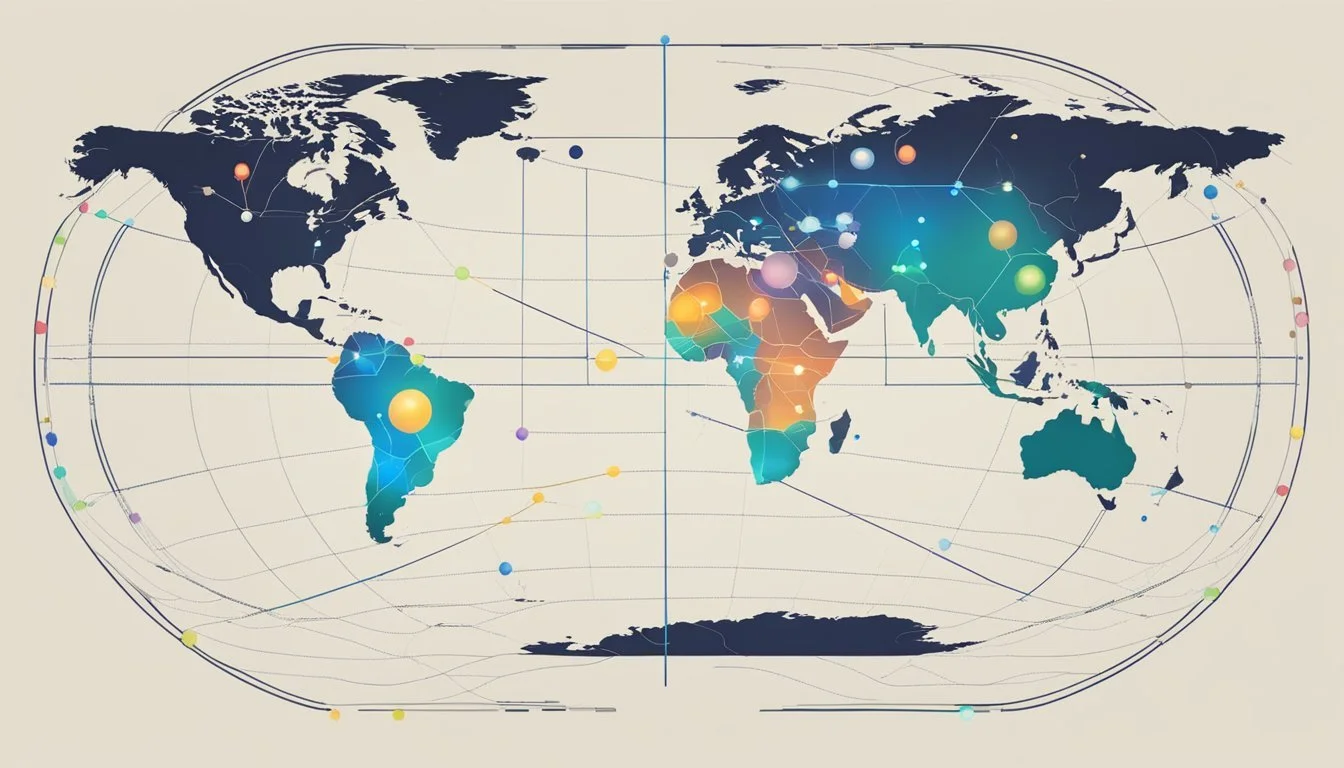
UFO sightings are mapped geographically using databases of public reports, which are plotted on digital or interactive maps to reveal where and how often these events occur. Researchers and organizations collect details such as time, location, and description of each sighting, making it possible to visualize patterns and regional hotspots. These maps often highlight areas with frequent reports, such as the American West and parts of Europe, reflecting both actual activity and differences in reporting behavior.
Today's UFO sighting maps range from simple online lists to advanced, interactive tools that display trends over the past century. This approach allows analysts and enthusiasts to study how sightings are distributed across states, countries, and even globally. By making this data accessible, mapping helps bring clarity to a topic often surrounded by speculation.
Overview of UFO and UAP Sightings

Sightings of unidentified aerial phenomena (UAP), also historically called unidentified flying objects (UFOs), have taken place across many regions and time periods. These sightings draw public attention, shape cultural perceptions, and have prompted formal investigations by scientific, military, and government organizations.
Defining UFOs and UAPs
A UFO refers to any aerial object or light that cannot be immediately identified. In recent years, the term UAP (Unidentified Aerial Phenomena) has been adopted by scientific and government agencies to broaden the definition and reduce stigma.
The change in terminology reflects efforts to promote a more objective approach to investigation. Reports may involve lights, structured objects, or aerial movements that appear unusual to witnesses. Not all sightings remain unidentified after investigation; many are eventually explained as aircraft, weather phenomena, or other natural causes.
Agencies like the Pentagon and analysis by independent centers, such as the National UFO Reporting Center, categorize reports based on the evidence available. This enables more systematic data collection and analysis.
Historical Perspectives on Sightings
Early documented UFO sightings date back to the mid-20th century, notably the post-World War II era. The 1947 Kenneth Arnold sighting in Washington state is often cited as a catalyst for modern public interest.
The U.S. Air Force initiated projects like Project Blue Book to investigate reports during the 1950s and 1960s. The volume and geographic spread of sightings have fluctuated over the decades. Some surges in reports have coincided with technological advancements or geopolitical tension.
Modern organized databases, such as those maintained by the National UFO Reporting Center, allow for structured mapping and historical analysis. These databases provide details like date, location, and sighting descriptions, creating a valuable resource for ongoing study.
Public Awareness and Media Involvement
Media coverage plays a pivotal role in shaping public perceptions of UAP and UFO sightings. Notable incidents—like the 1997 Phoenix Lights or recent Navy pilot accounts—have generated widespread attention through news reports, documentaries, and social media.
Public interest often rises after official releases of government information or prominent witness testimonies. Television, radio, and now digital platforms facilitate quick dissemination of sighting reports and expert commentary.
The interplay between public awareness and media results in increased reporting rates. This dynamic makes it possible to track patterns, identify hotspots, and direct further scientific or governmental review. Reports submitted to organizations and shared in the media help build a clearer geographic picture of sightings nationwide.
Key Organizations Tracking Sightings
Multiple groups have established systematic methods to collect, verify, and map UFO reports. Their roles are crucial for producing reliable data and supporting geographic analysis of sightings across regions.
Role of the National UFO Reporting Center
The National UFO Reporting Center (NUFORC) is one of the most prominent organizations for public UFO and UAP sighting reports in the United States. It maintains a continuously updated online database that includes thousands of reports submitted by individuals worldwide.
NUFORC provides a comprehensive interactive map on its website, allowing users to explore sightings by location and date. Data fields typically include the date, time, location, shape, and a brief description of each sighting.
The center relies on voluntary, confidential submissions and does not draw definitive conclusions about the origin or nature of the events reported. NUFORC’s data is frequently used by researchers and media outlets to identify sighting patterns, hotspots, and trends.
Other Major Research Institutions
Beyond NUFORC, other organizations have played significant roles in tracking and analyzing UFO sightings. The Mutual UFO Network (MUFON), for example, is a nonprofit group that conducts investigations and maps cases both domestically and internationally.
Academic institutions and certain government agencies have occasionally participated in related research, often using geospatial analysis techniques to identify areas of concentrated activity. Some utilize GIS-based tools and clustering algorithms, such as k-means, to visualize data geographically.
Online platforms and private mapping initiatives further contribute by combining reported sightings from multiple sources into accessible public maps. These methods help increase transparency and allow both researchers and the public to explore geographic patterns of UFO activity.
Geospatial Data Collection Techniques

Accurate mapping of UFO sightings depends on the systematic collection of spatial data. Researchers rely on specific location details, like geographic coordinates or granular address information, to analyze patterns and trends.
Collecting Geographic Coordinates
Geographic coordinates—latitude and longitude—serve as the standard reference for pinpointing the location of a sighting. Witnesses or investigators may submit GPS data directly from mobile devices or use web tools to select the sighting location on a digital map.
Utilizing precise coordinates enables the mapping of sightings as points on spatial databases. Patterns can then be visualized using heat maps or cluster plots. Data collected may be adjusted to reflect time and date, which supports both spatial and temporal analysis.
A common format for reporting is decimal degrees, for example:
Latitude Longitude 34.0522 -118.2437
If only rough descriptions are given, tools like geocoders can estimate coordinates from place names.
Utilizing Address-Level Data
Some sighting reports provide a street address, neighborhood, or city name rather than exact coordinates. Address-level data increases accessibility, since most people recall or record locations as addresses rather than as latitude and longitude.
Researchers geocode these addresses, converting them into coordinates compatible with mapping software. This process can introduce small inaccuracies, especially when the original address is vague or refers to a wide area.
When privacy is a concern, address data may be generalized to the nearest street or community rather than to a specific household or property. This compromise balances individual privacy with the need for accurate spatial analysis.
Mapping UFO Sightings Geographically

UFO sightings are recorded and analyzed using modern mapping techniques, which reveal patterns and hotspots in specific regions. Geographic data helps researchers identify trends, clusters, and possible explanations for increased sightings in some areas.
Visualization Methods and Tools
Several digital platforms, including interactive maps and geospatial analysis software, are used to plot UFO sightings. Organizations such as the National UFO Reporting Center (NUFORC) collect reports and display them on detailed maps for public and academic review.
Shape, time, and location data are often part of the visualization. Popular visualization methods include heat maps, pin clusters, and time-lapse animations. These tools make it possible to compare sightings across years or regions, highlighting both common and anomalous areas.
Bar charts and tables illustrate features like UFO shapes or frequency by location. This approach aids both researchers and the public in understanding the distribution and characteristics of reported sightings.
Patterns in Distribution
Mapping data frequently reveals non-random distribution of UFO sightings, with clear concentrations in certain states and cities. Urban areas, locations with open skies, and sites near military installations often report higher numbers of cases.
In the US, clusters regularly appear in California, Florida, Texas, and New York, along with more rural areas like South Carolina and regions of New Mexico. Temporal analysis usually shows spikes during specific months or after notable incidents in media.
Researchers have used spatial clustering and statistical correlation analyses to identify factors that may influence reporting rates, such as population density or cultural interest in UFO phenomena.
Case Study: South Carolina
South Carolina is a notable state for frequent UFO sightings, especially along coastal and rural communities. Mapping efforts show that reports tend to cluster near Myrtle Beach and Columbia.
Local law enforcement, civilians, and aviation professionals have contributed detailed accounts, enhancing data reliability. Coastal geography and a large share of clear-weather nights make observation conditions favorable for skywatchers in this region.
Analysis of mapped data also finds that many South Carolina sightings involve luminous objects or unexplained lights, which are regularly reported moving over water or next to state parks.
Case Study: Roswell, New Mexico
Roswell’s status in UFO history stems from a highly publicized 1947 incident involving a crashed object. Geographic mapping of reports around Roswell shows an unusual concentration compared to other rural US areas.
Modern mapping tools document not only historical cases but ongoing sightings. The city and neighboring desert remain marked for above-average reporting rates, drawing tourists and researchers every year.
Mapped data often highlights that the majority of events near Roswell involve disc-shaped or glowing craft, matching witness descriptions from the original incident and later observations in the region.
Analysis of UAP Sightings Data
Analysis of UAP sightings uses a combination of geographic, temporal, and environmental data to identify patterns and trends. Findings show differences in observation rates by region, shifts in sightings over time, and notable geographic concentrations.
Trends by Region
Reports of UAP sightings are not evenly distributed across the United States. The western states, including Nevada, Arizona, and California, consistently show higher rates of reports per capita when compared with the Midwest and Northeast.
One study mapping over 100,000 public reports found that geography plays a significant role, with mountainous and low-population areas often recording more sightings. Factors like light pollution, urban density, and visibility conditions affect these numbers, possibly limiting sky visibility in some regions.
Besides environmental factors, differences in reporting culture and local interest may contribute. These regional differences provide direction for targeted investigation into why certain areas generate more sighting reports.
Temporal Trends
UAP sightings display cyclic patterns by time of day, season, and year. Most reports occur during the evening hours, peaking between 8:00 pm and midnight, likely due to greater sky visibility and increased human outdoor activity after dusk.
Annual trends show periodic spikes in the number of reported sightings. For example, certain years in the last decade saw marked increases, often coinciding with media attention or the publication of prominent government or scientific reports.
Seasonal patterns also emerge. The majority of sightings cluster in summer months when people spend more time outdoors. This aligns with time series analysis from current mapping studies.
Notable Clusters and Hotspots
A few locations consistently stand out as hotspots for UAP sightings. The areas around Las Vegas, Phoenix, and the Pacific Northwest—especially near military installations—report significantly higher case densities.
A table summarizing three notable clusters:
Location Key Features Reporting Rate Las Vegas, NV Near Nellis AFB, clear skies Very High Seattle, WA region Urban, near airfields High Hudson Valley, NY Rural/suburban mix Moderate/High
Environmental features, such as low light pollution and open horizons, can encourage more sightings. High-profile clusters have sometimes triggered focused scientific and military attention, which may in turn influence local reporting volumes.
Impact on National Security and Public Discourse

Geographic patterns of UFO sightings have shaped official reactions and public debate. Where sightings are clustered, authorities and security agencies have had to assess potential risks and address widespread interest.
Government Response to Geographic Concentrations
Government agencies pay special attention to areas with high numbers of UFO sightings, especially around sensitive military sites or strategic infrastructure. These clusters may lead to increased investigation to determine whether the sightings are caused by natural phenomena, civilian activity, or potential security threats.
National security organizations, such as the U.S. Department of Defense, often cross-reference geographic data with known movement of military assets. For example:
Location Reported Sightings Security Overlap Western U.S. States High Military Test Ranges, Bases Coastal Regions Moderate Naval Operations
Large numbers of reports in certain areas sometimes prompt briefings, internal memos, or task forces to clarify if there is any genuine concern.
Implications for Security Policy
Clusters of reports can influence security policy by prompting the development of protocols for report collection, analysis, and interagency communication. Policies are updated to ensure rapid assessment of any sighting that occurs near critical infrastructure.
High concentrations of sightings can also lead to collaboration between the military, civilian agencies, and scientific organizations. Documented procedures help rule out false alarms and maintain public trust.
Addressing patterns in UFO sightings allows security officials to focus investigative resources where potential risks are higher. This helps shape a measured, evidence-based connection between unidentified phenomena and national security readiness.